
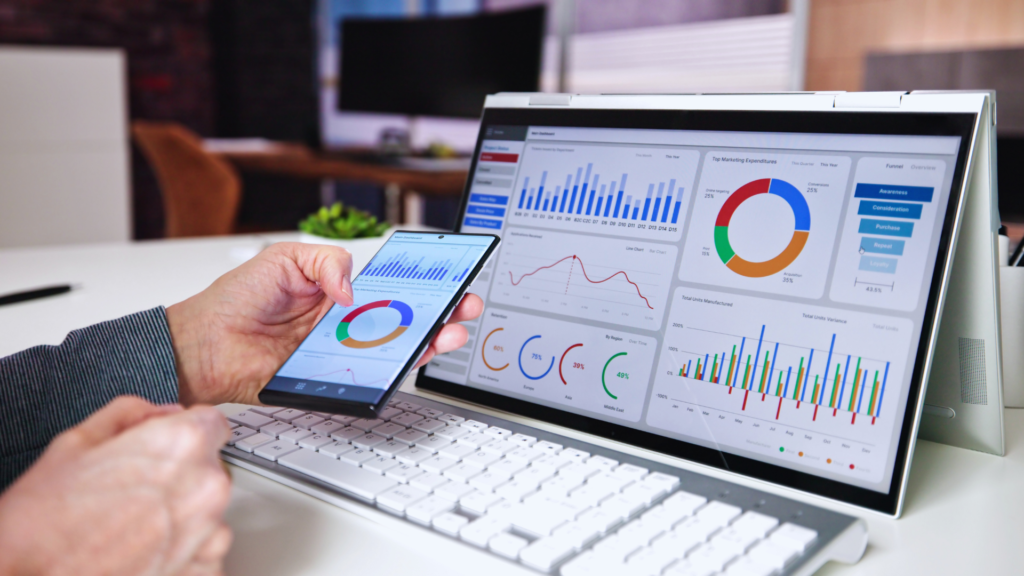
Small businesses need reliable analytics tools to make informed decisions and track growth effectively. These tools help gather data on customer behavior, sales trends, and marketing performance without overwhelming budgets or technical skills.
The best analytics tools for small businesses combine ease of use, affordability, and actionable insights to drive smarter business strategies. Choosing the right tool can improve efficiency and provide a clearer picture of what works and what doesn’t.
This post covers essential analytics options designed specifically for small business needs. Understanding their strengths will help you select the tool that fits your goals and resources.
Understanding Analytics Tools for Small Businesses
Analytics tools help businesses collect and analyze data to make informed decisions. They offer insights into customer behavior, sales patterns, and marketing effectiveness. Different tools serve various purposes, from tracking website traffic to measuring financial performance.
What Are Analytics Tools?
Analytics tools are software applications designed to gather, process, and visualize data. They enable businesses to monitor key metrics like user engagement, sales conversions, and operational efficiency. For small businesses, these tools often integrate with existing systems such as websites, social media, and sales platforms.
Such tools range from simple dashboards displaying basic statistics to advanced platforms using machine learning to predict trends. Common features include customizable reports, real-time data updates, and automated alerts. This capability allows businesses to address issues quickly and optimize strategies based on actual data rather than assumptions.
Benefits of Analytics for Small Businesses
Analytics provide small businesses with a clearer understanding of their customers and operations. They help identify which products or services perform best and reveal areas where costs can be reduced. This leads to improved marketing ROI, as campaigns can be tailored to target demographics that show the highest engagement.
Additionally, analytics support better inventory management by forecasting demand more accurately. Performance tracking also enables businesses to compare results over time and make data-driven decisions without relying solely on intuition. This reduces risk and increases the chances of sustainable growth.
Common Types of Analytics Solutions
Small businesses typically use three main types of analytics solutions: descriptive, predictive, and prescriptive analytics.
- Descriptive analytics summarize historical data, showing what happened. For example, monthly sales reports or website traffic summaries.
- Predictive analytics uses historical data to forecast future events, like predicting customer churn or sales trends.
- Prescriptive analytics recommend actions based on predictions, such as optimizing stock levels or adjusting marketing budgets.
Many small business tools combine these types to provide a comprehensive view. Popular platforms include Google Analytics for web data, QuickBooks for financial insights, and social media analytics tools like Facebook Insights.
Key Features to Look for in Analytics Tools
Effective analytics tools offer easy access to data, flexible options for report creation, and the ability to work well with other software. These aspects ensure smooth data interpretation and informed decision-making.
User-Friendly Dashboards
A dashboard should provide clear visualizations such as charts, graphs, and tables that make data easy to digest at a glance. It must allow quick navigation between different metrics without clutter or confusing layouts.
Look for dashboards that offer real-time updates so users can monitor performance immediately. Customizable views help focus on relevant data, reducing noise from irrelevant metrics. Accessibility on multiple devices, including mobile, is also important for convenience.
Customizable Reports
Reports must be tailored to specific business needs, allowing users to select data points, time frames, and formats. This flexibility supports different departments, whether marketing tracking campaigns or finance monitoring sales trends.
Tools that enable automated report scheduling save time and maintain regular insights without manual effort. Export options like PDF, Excel, or CSV allow further analysis or sharing with stakeholders. Custom templates can standardize reporting, boosting efficiency.
Integration Capabilities
Analytics tools should seamlessly connect with common business software such as CRM systems, e-commerce platforms, and marketing apps. This integration centralizes data collection and ensures consistency across platforms.
APIs and pre-built connectors simplify the process, reducing setup time and technical barriers. Integration with communication tools can automate alerts and reporting. The ability to sync with multiple data sources provides a fuller picture of business performance.
Top Analytics Tools for Small Businesses
Effective data tracking, reporting flexibility, and user-friendly interfaces are essential features to evaluate when choosing an analytics tool. Budget constraints and integration options also play a crucial role for small businesses aiming to extract actionable insights.
Google Analytics
Google Analytics is a free tool widely used for website traffic analysis. It provides detailed reports on user behavior, acquisition channels, and conversion tracking. Small businesses benefit from its ability to segment data by demographics, device type, and location.
Setup involves adding a tracking code to your website, allowing real-time monitoring of visitors. Google Analytics integrates seamlessly with Google Ads and Search Console, enabling robust marketing campaign analysis. The platform also supports custom dashboards and alerts.
However, it has a learning curve due to its extensive features, and the free version’s limitations on data retention and sampling may affect businesses with large datasets. Still, it remains a powerful choice for identifying audience trends and improving online presence.
Zoho Analytics
Zoho Analytics offers an affordable, user-friendly BI solution designed for small and medium-sized businesses. Its drag-and-drop interface simplifies building custom reports and visualizations without extensive technical knowledge.
The tool supports data integration from multiple sources, including CSV files, cloud applications, and databases. Automated data syncing schedules maintain up-to-date insights. Advanced analytics features like predictive modeling and AI-powered smart insights assist in forecasting and decision-making.
Collaboration is enabled through shared dashboards and report export in various formats. Zoho Analytics also provides mobile apps, allowing access to analytics on the go. It balances simplicity and capability, suitable for growing companies.
Tableau
Tableau is known for its advanced data visualization capabilities and is scalable for small businesses willing to invest in robust analytics. It enables the creation of interactive and highly customizable dashboards with drag-and-drop ease.
Tableau supports connections to hundreds of data sources, ranging from spreadsheets to cloud databases. Its in-memory engine accelerates query performance even on large datasets. Users can drill down into data layers to uncover deeper insights.
Though it requires some learning, Tableau offers extensive online resources and community support. Licensing costs are higher compared to basic tools, but justified by its powerful visualization and analytical depth. It’s ideal for businesses that prioritize data storytelling.
Microsoft Power BI
Microsoft Power BI integrates seamlessly with other Microsoft 365 products, often used by small businesses. It delivers strong data connectivity options and robust visualization features at a competitive price.
Power BI enables importing data from Excel, SQL Server, Azure services, and many more sources. Its Power Query tool allows data transformation without coding. Custom visuals and AI-driven analytics enhance data interpretation.
The platform offers interactive reports and real-time dashboard updates. Power BI Desktop is free, while Power BI Pro expands collaboration and sharing capabilities. This tool fits businesses invested in Microsoft ecosystems seeking scalable, self-service analytics.
Affordable Analytics Solutions
Cost-effective analytics tools can provide powerful insights without straining budgets. Some options offer free access to essential features, while others balance affordability with advanced capabilities. Pricing often scales with usage, enabling businesses to grow without unexpected expenses.
Free Tools for Small Businesses
Several free analytics tools cater well to small businesses by offering core features at no cost. Google Analytics is a leading choice, known for comprehensive web traffic tracking, user behavior analysis, and conversion tracking. It’s suitable for most websites without requiring payment.
Other notable free tools include Microsoft Power BI Desktop, which allows data visualization and reporting on a local machine without charges, and Hotjar Basic, offering limited heatmaps and session recordings. However, free tiers usually come with restrictions on data volume, reporting frequency, or support.
Small businesses should evaluate if the free capabilities align with their needs before committing to paid plans.
Best Value-for-Money Options
Tools that offer strong analytics features at moderate prices deliver excellent value. For example, Mixpanel provides event tracking and funnel analysis starting at $25/month, combining usability with powerful insights. Tableau Creator offers advanced visualization abilities for around $70/month but includes a desktop application and broad data source integration.
Value-focused products typically include real-time data processing, customizable dashboards, and user segmentation. Some also feature free trials or flexible monthly billing, lowering the risk of investment.
Choosing the best value option depends on the business’s data complexity, technical skills, and expected growth.
Scalable Pricing Models
Scalable pricing allows businesses to start small and pay more as their data and user bases grow. Many analytics platforms use tiered plans based on monthly active users, data points tracked, or server resources consumed.
For instance, Google Analytics 4 remains free for most users, but Google Analytics 360 charges high-scale enterprises with extended features. Tools like Kissmetrics and Heap Analytics offer pay-as-you-grow models, which ensure cost efficiency during early stages.
This approach minimizes upfront costs while enabling gradual enhancement of analytics capabilities aligned with business expansion.
Industry-Specific Analytics Tools
Different industries require tailored analytics solutions that focus on the unique data points and performance indicators relevant to their operations. These tools help businesses track critical metrics, optimize processes, and make informed decisions specific to their market.
E-Commerce Analytics Solutions
E-commerce businesses benefit from analytics platforms that track customer behavior, sales patterns, and website performance. Tools like Google Analytics 4 and Klaviyo provide insights into user journeys, abandoned carts, and conversion rates, helping optimize marketing efforts and increase sales.
Features such as real-time traffic monitoring and A/B testing are crucial. Integration with payment gateways and inventory management allows seamless data flow. Retailers also need advanced segmentation to target specific customer groups based on purchasing history.
Service-Based Business Analytics
Service companies rely on analytics tools that focus on client engagement, appointment scheduling, and customer satisfaction. Platforms like HubSpot and Zoho Analytics provide detailed reports on lead conversion, service delivery times, and feedback analysis.
Tracking customer retention and churn rates is key. These tools often include CRM integration to manage contact data efficiently. Customizable dashboards give teams the ability to monitor operational performance and optimize service quality continuously.
Retail Analytics Platforms
Retailers need platforms designed to track in-store and online sales, inventory levels, and foot traffic. Solutions such as Shopify Analytics and Square for Retail offer detailed insights into product performance and promotional effectiveness.
Point-of-sale data integration is essential for a unified view of operations. Retail analytics also includes heatmaps and customer demographic analysis to improve store layout and marketing. Understanding purchase trends helps plan inventory and staffing efficiently.
Comparing Analytics Tools: Ease of Use and Support
Choosing an analytics tool involves assessing how quickly users can learn it and the quality of available support. Clear training materials and accessible customer service can reduce downtime and improve productivity for small businesses.
Learning Curve and Training Resources
Some tools offer intuitive interfaces with drag-and-drop features, requiring minimal technical skills. Others, like Google Analytics, have steeper learning curves due to advanced customization options and complex terminology.
Many platforms provide extensive tutorials, webinars, and documentation. For example, Tableau offers an extensive free learning library, while Microsoft Power BI includes interactive guided learning. Tools with in-app help features or community-driven FAQ sections can accelerate onboarding.
The availability of templates and pre-built reports also impacts ease of use. Solutions that allow quick deployment of dashboards lessen the initial effort needed to extract insights and are better suited for users without a strong analytics background.
Customer Support and Community
Responsive customer support varies widely between tools. Paid platforms like Adobe Analytics typically offer 24/7 phone and chat support, while free or lower-cost options rely heavily on online resources and community forums.
Active user communities contribute to faster troubleshooting and peer-to-peer learning. Products with dedicated user groups on platforms such as Reddit or LinkedIn can be valuable for ongoing assistance.
Service level agreements (SLAs) guarantee support response times, which are crucial for businesses that depend on real-time data analysis. Before purchase, check if support availability aligns with your operating hours and technical needs.
Leveraging Analytics for Business Growth
Understanding how to use data effectively can directly impact decision-making and profitability. Focusing on the right metrics and refining marketing strategies are essential steps in turning information into action.
Tracking Key Performance Indicators
Identifying and monitoring Key Performance Indicators (KPIs) allows businesses to measure progress toward goals clearly. Common KPIs for small businesses include customer acquisition cost, conversion rates, and monthly recurring revenue.
Regularly reviewing these metrics helps detect trends and areas needing attention. For instance, noticing a drop in conversion rates can prompt a reassessment of sales tactics or website usability.
Using dashboards and real-time reporting tools simplifies KPI tracking. These tools present data visually, making it easier for business owners to interpret numbers without needing technical expertise.
Improving Marketing Effectiveness
Analytics tools help pinpoint which marketing channels yield the best return on investment. Tracking user engagement across platforms—such as email, social media, and paid ads—clarifies where to allocate budget.
Testing campaigns through A/B testing and analyzing customer behavior data optimizes messaging and targeting. Small businesses gain insight into demographic responses and can adjust content accordingly.
Analytics also support customer segmentation, enabling personalization in marketing efforts. Tailored promotions can increase engagement and conversion by addressing specific audience needs and preferences.
Security and Data Privacy Considerations
Small businesses must prioritize protecting their data and customer information when choosing analytics tools. Understanding built-in security features and how the tools comply with legal requirements is critical to maintaining trust and avoiding costly breaches.
Data Protection Features
Many analytics tools offer encryption both in transit and at rest to safeguard sensitive information. Access controls are commonly included, allowing businesses to restrict data based on user roles or departments. Look for multi-factor authentication (MFA) to add an extra layer of security.
Regular automated backups and audit logs help track data usage and recover information if needed. Tools with data anonymization or masking help limit exposure of personally identifiable information (PII). Ensure any integration with third-party apps also meets stringent security standards.
Compliance with Regulations
Adherence to data protection regulations like GDPR, CCPA, or HIPAA varies by tool and region. Check if the analytics platform provides features to help manage data subject rights, such as data access or deletion requests.
Many vendors publish compliance certifications and details about their data handling practices. Businesses should confirm where data is stored geographically to comply with regional laws. Failure to comply can result in fines and damage to the business’s reputation.
Implementing Analytics Tools Successfully
Choosing the right analytics tool is just the first step. Successful implementation involves clear planning and alignment with business goals. Define what metrics matter most to your business before integrating any software.
Training is crucial. Ensure your team understands how to use the tool effectively. This can include formal training sessions or guided tutorials.
Data quality impacts results significantly. Regularly audit your data inputs for accuracy and completeness. Poor data leads to misleading insights.
Use dashboards and reports to keep information accessible. Customizable views help different team members track relevant KPIs without sifting through unrelated data.
| Key Steps for Implementation | Description |
| Define Objectives | Identify clear goals and metrics |
| Train Staff | Provide hands-on learning |
| Ensure Data Quality | Regular data audits and cleaning |
| Customize Dashboards | Tailor views for different users |
| Monitor & Adjust | Review tool usage and refine setup |
Consistent use of analytics tools is necessary to make meaningful decisions. Schedule regular check-ins to assess the insights generated and adjust your approach as needed.